

Healthspan is the number of years you live in full health. Lifespan is the total number of years you live. In Australia both are measured, by different agencies, and the distance between them is close to a decade.
That decade is the part nobody plans for. The life expectancy figure climbs, the headlines celebrate it, and the years being added are not all good ones. The number worth watching is the second one, because it is the one that decides what the extra years are like.
This article puts the actual Australian figures on that gap, names the source of every one of them, and separates the levers with real evidence behind them from the ones with only marketing behind them.
HLTH+ has already argued why the distinction matters, in Lifespan vs Healthspan: Why Living Longer Doesn't Always Mean Living Better. Read that one for the idea. This is the other half: the arithmetic underneath it.
What does healthspan actually mean, and how is it measured?
Healthspan has no single legal definition, but it has a working one that statisticians use: health-adjusted life expectancy, or HALE. HALE takes ordinary life expectancy and subtracts the years expected to be lived with illness, injury or disability, weighted by how severe those states are.
A related measure, disability-free life expectancy, is blunter. It counts years lived without disability and stops there, with no weighting for severity, so it answers a narrower question than HALE does.
HALE is the metric the Global Burden of Disease study reports for every country. Globally, HALE at birth was 62.2 years in 2021, up from 61.3 years in 2010, and it fell by 2.2% between 2019 and 2021 (GBD 2021 Diseases and Injuries Collaborators, The Lancet, 2024). Australia sits well above that global figure, which is exactly why the local numbers are the ones to use.
How big is the gap between lifespan and healthspan in Australia?
Roughly ten years for males and roughly twelve for females. Two agencies publish the pieces, and it is worth keeping them separate rather than mixing one source's life expectancy with another's healthspan.
| Measure | Males | Females |
|---|---|---|
| Life expectancy at birth (ABS, 2022 to 2024) | 81.1 years | 85.1 years |
| Life expectancy at birth (AIHW Burden of Disease Study 2024) | 81.6 years | 85.5 years |
| Health-adjusted life expectancy (AIHW, 2024) | 71.7 years | 73.8 years |
| Years expected in ill health (AIHW, 2024) | 9.9 years | 11.7 years |
| Share of life expected in full health (AIHW, 2024) | 88% | 86% |
Sources: ABS, Life expectancy, 2022 to 2024 and AIHW, Australian Burden of Disease Study 2024, health-adjusted life expectancy.
Note the direction of the difference between the sexes. Females live about four years longer and spend about two more of those years in ill health, so the longer life does not translate one-for-one into more good years.
Why has the gap not closed?
Because both numbers have been rising together. Compared with 20 years ago, Australians live longer and spend more years in full health, but the years spent in ill health went up too, by 1.2 years for males and 1.5 years for females, leaving the proportion of life in full health unchanged (AIHW, Australian Burden of Disease Study 2024).
That is the finding that reframes the whole conversation. Medicine has been extending survival with illness at roughly the same pace it has been extending life, so the share of your life spent unwell has held steady while both totals grew.
Chronic conditions are the reason. They contributed to around 9 in 10 deaths in Australia in 2022 (AIHW, chronic conditions), and because most of them are managed for years rather than resolved, they fill the gap years rather than ending them. The silent gap: why "healthy" isn't enough covers what that looks like before a diagnosis exists.
What actually drives the gap?
A measurable share of it is modifiable. The AIHW attributes 36% of Australia's total disease burden in 2024 to the modifiable risk factors it models, out of 5.8 million years of healthy life lost, with 54% of the total burden coming from living with illness or injury rather than dying early (AIHW, Australian Burden of Disease Study 2024).
The five biggest contributors are unglamorous, and four of the five are metabolic or dietary.
| Risk factor | Share of total disease burden, 2024 |
|---|---|
| Overweight, including obesity | 8.3% |
| Tobacco use | 7.6% |
| All dietary risks | 4.8% |
| High blood pressure | 4.4% |
| High blood plasma glucose | 4.2% |
Read that table as a ranking of leverage, not a list of blame. It says the things with the most measured effect on the gap are body composition, what you eat, what you smoke and what your blood does, which is a very different list from the one the longevity market advertises.
More on how nutrition is framed for people eating less than they used to: HLTH+ nutrition support.
Which levers have real evidence behind them?
Three are worth knowing about, and the evidence behind them differs a lot in strength. They are listed here in descending order of how well the research supports them.
Muscle and strength
This is the strongest of the three, and the dose is smaller than most people assume. A systematic review and meta-analysis of 16 prospective cohort studies found muscle-strengthening activity associated with a 10% to 17% lower risk of all-cause mortality, cardiovascular disease, total cancer, diabetes and lung cancer, independent of aerobic activity (Momma et al, British Journal of Sports Medicine, 2022;56:755-763).
The shape of the curve matters as much as the headline. The maximum risk reduction appeared at roughly 30 to 60 minutes a week, and beyond about an hour a week the review found no clear further benefit. Two short sessions is the evidenced dose, not two hours a day.
Protein adequacy, stated honestly
Protein is oversold as a mass problem and undersold as an older-age one. In Australia, 98.5% of people had an adequate protein intake in 2023; the gap sits almost entirely in the oldest group, where 14.7% of males and 6.2% of females aged 75 and over fell short (ABS, Usual nutrient intakes, 2023).
So the honest version is narrow: most Australian adults eating normally are getting enough protein, and the people who are not are older, eating less, or both. Protein contributes to the maintenance and growth of muscle mass and to tissue repair, which is why adequacy matters more as strength becomes the lever. How much protein to build muscle works through the numbers, and the best protein powder for women compares the formats.
Micronutrient status
This is where the Australian data is genuinely alarming, and it is the least discussed of the three. In 2023, 63.7% of Australians aged 2 and over had an inadequate calcium intake from food and drink, 75.7% of females against 52.1% of males, while 22.9% fell short on vitamin A and 17.3% on iron, rising to 26.8% among females (ABS, Usual nutrient intakes, 2023).
Calcium is necessary for normal teeth and bone structure, and vitamin D is necessary for normal bone structure, which makes a two-in-three shortfall on one of them worth taking seriously rather than filing under "probably fine". Requirements also move with age and sex, which is why the picture changes again after 50: see calcium supplements, the best magnesium supplement and perimenopause symptoms.
Where does the evidence run out?
At almost everything sold as a longevity product. This is the part the category tends to skip, and it is the reason to trust the three levers above rather than the shelf.
The largest test of the idea remains a Cochrane review of 78 randomised trials covering 296,707 participants, which concluded: "We found no evidence to support antioxidant supplements for primary or secondary prevention. Beta-carotene and vitamin E seem to increase mortality, and so may higher doses of vitamin A" (Bjelakovic et al, Cochrane Database of Systematic Reviews, 2012).
Australia ran its own version of that test. The D-Health Trial randomised 21,308 adults aged 60 to 85 to monthly vitamin D or placebo for up to five years and found no difference in cancer incidence between the groups (hazard ratio 1.02, 95% confidence interval 0.95 to 1.10) (Neale et al, Journal of Steroid Biochemistry and Molecular Biology, 2025;250:106738).
The reading that survives both results is narrow and useful. Supplementing a nutrient you already have enough of has not bought anyone extra healthy years in a trial; correcting a genuine shortfall is a completely different question, and it is the only one a nutrition product should be answering. Vitamins when you are eating less covers what that means in practice.
What happens when you are eating less than you used to?
The shortfall arrives faster, because a smaller total intake carries a smaller total of everything in it. That applies whether the cause is a deliberate deficit, a change in appetite with age, or a GLP-1 medication. Fewer calories eaten means fewer nutrients eaten, and requirements do not fall to match.
This article is general information, not medical advice. Decisions about any medication belong with your doctor. Nutrition while eating less goes through what changes on the plate.
Where a Formulated Supplementary Food fits
We believe in a food-first approach. The statistics say it is not working on its own: over 90% of Australian adults do not meet dietary guidelines (AIHW, poor diet in adults), and only 4.8% of adults aged 18 and over ate the minimum recommended serves of vegetables, legumes and beans in 2023 (ABS, Consumption of food groups from the Australian Dietary Guidelines, 2023).
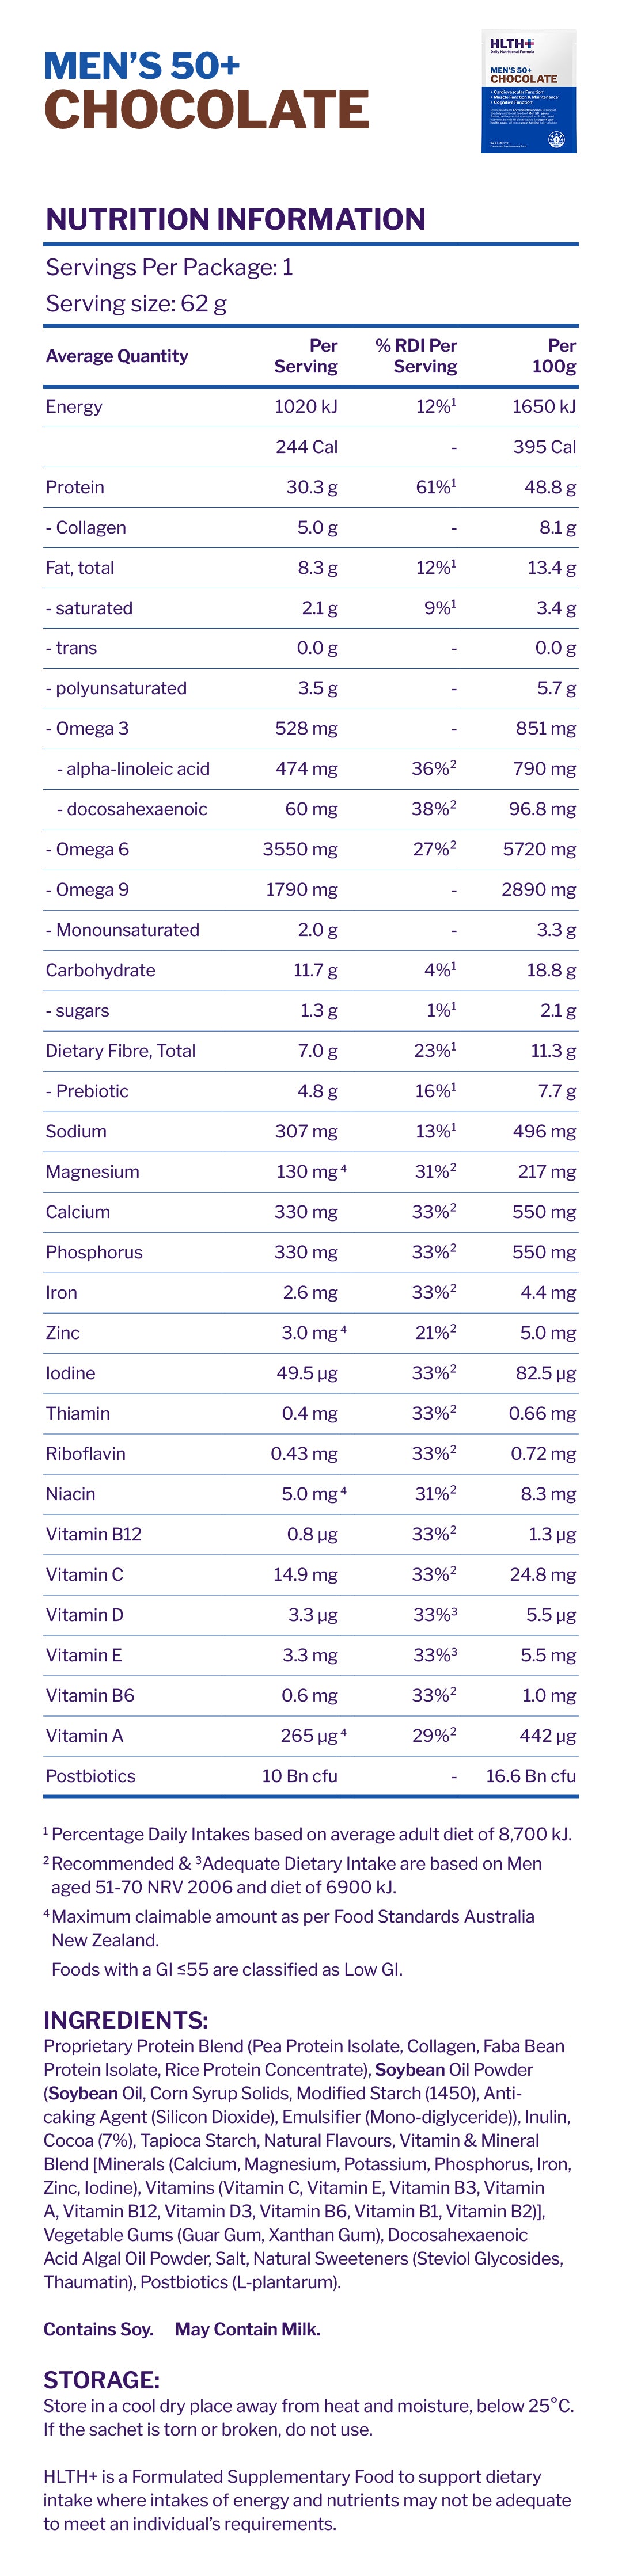
That is the case for nutritional insurance, and nothing more than that. HLTH+ is a Formulated Supplementary Food: one 55g sachet carries 30g protein per serve and 7g dietary fibre, alongside a balanced multivitamin profile.
Each formula is built to the Nutrient Reference Values published in 2006 by the National Health and Medical Research Council, the Australian Government Department of Health and Ageing and the New Zealand Ministry of Health, by gender and life stage: Women's, Women's 50+, Men's and Men's 50+. That matters because the reference values themselves move at 30, 50 and 70, so a single formula built to one average cannot sit correctly against all of them. Protein contributes to the maintenance and growth of muscle mass and to tissue repair; magnesium contributes to a reduction of tiredness and fatigue.
The fastest way to find out whether you have a real shortfall or an imagined one is to look at what your current stack is actually missing. Take the Find My Formula quiz and see what is not covered.
Frequently Asked Questions
What is the difference between healthspan and lifespan?
Lifespan counts total years lived. Healthspan counts years lived in full health. The AIHW measures the second as health-adjusted life expectancy, which subtracts years expected to be spent with illness or disability. In 2024 that was 71.7 years for Australian males and 73.8 years for females.
How many years do Australians spend in poor health?
About 9.9 years for males and 11.7 years for females, according to the AIHW's Australian Burden of Disease Study 2024. That is 12% of male life expectancy and 14% of female life expectancy. Both figures have grown over the past 20 years, even as total life expectancy rose.
Can supplements increase your healthspan?
No trial has shown that. A Cochrane review of 78 trials and 296,707 people found no evidence supporting antioxidant supplements for prevention, and Australia's D-Health Trial found no effect of vitamin D on cancer incidence. Correcting a measured dietary shortfall is a separate and better-evidenced question.
What has the strongest evidence for adding healthy years?
Muscle-strengthening activity has the clearest data. A 2022 meta-analysis of 16 cohort studies linked it to a 10% to 17% lower risk of all-cause mortality and major chronic disease, independent of aerobic exercise, with the benefit peaking at roughly 30 to 60 minutes a week.

Leave a comment
This site is protected by hCaptcha and the hCaptcha Privacy Policy and Terms of Service apply.